本文
第2次トランプ米政権が発足してから29日で100日を迎えた。
二転三転するトランプ氏の関税政策により世界が混乱する中、米国内はどのような変化がみられているのか。
スプートニクがインフォグラフィックで米経済の変化を追った。
分析対象項目は、以下の通り(10項目)
※注:短い日本語評価(例・不変、悪化など)は青山貞一
The secondary marked 100 days since the second Trump administration took
office. While the world is in turmoil due to Trump's tariff policy, which
has taken two or three different turns, what changes have been seen in
the U.S.?
Sputnik traced the changes in the U.S. economy in an infographic as follows;.
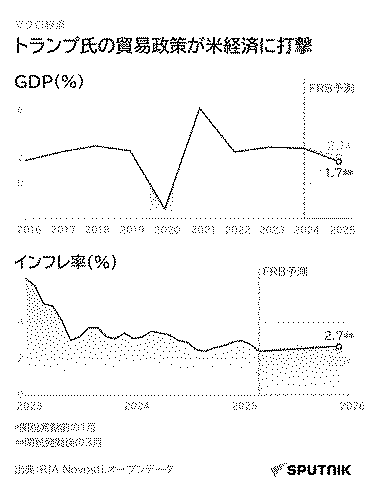
①GDP(%) ・・・下落
GDP (%) ・・・ Decline
②インフレ率(%) ・・・不変
Inflation rate (%) ・・・ Unchanged
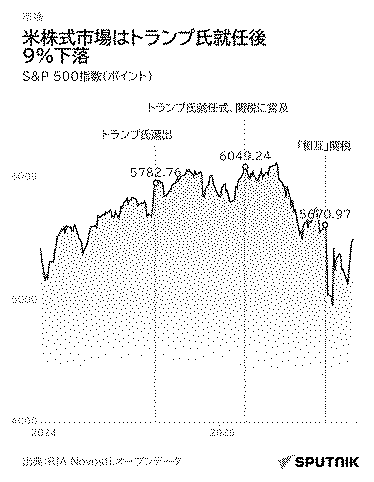
③米株式市場(%) ・・・大下落
U.S. stock market (%) ・・・ down sharply
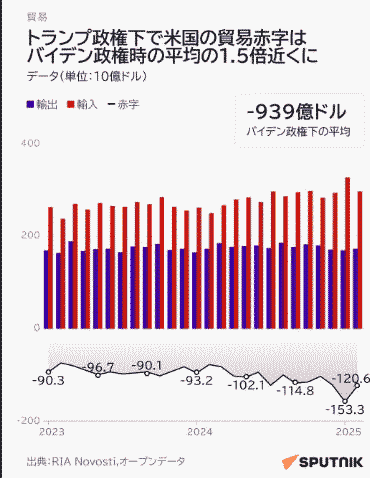
④米貿易赤字(倍率) ・・・約1.5倍悪化
U.S. trade deficit (multiplier) ・・・ Worsening by about 1.5 times
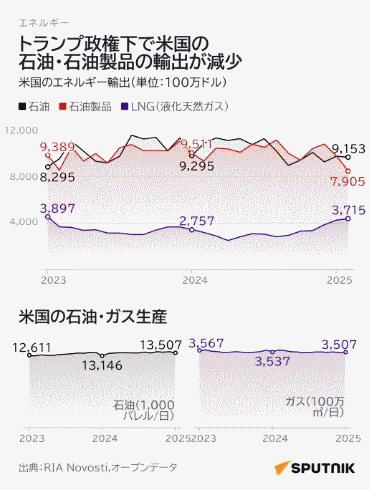
⑤石油・石油製品輸出(100万ドル) ・・・減少
Petroleum and petroleum product exports (million dollars) ・・・ down
⑥米国の石油・ガス生産(石油は1000バーレル/日) ・・・不変
U.S. oil and gas production (1,000 barrels/day for oil) ・・・ Unchanged
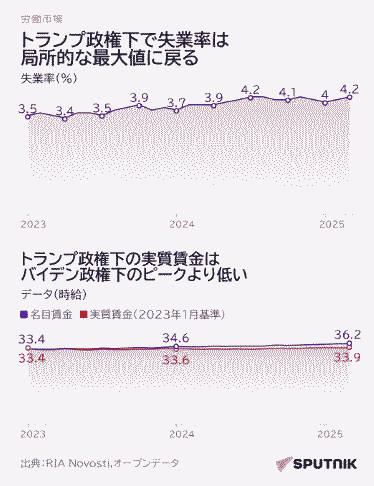
⑦失業率(%) ・・・局所的に最高値に戻る
Unemployment rate (%) ・・・ Locally back to the highest level
⑧実質賃金(時給) ・・・バイデン政権最高値より低い
Real wages (hourly) ・・・ lower than the Biden administration's high
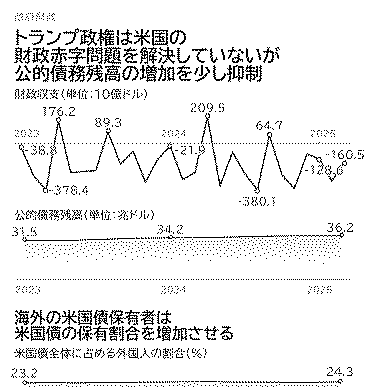
⑨公的債務残高(10億ドル) ・・・少し抑制
Public debt outstanding (billion dollars) ・・・ Slightly suppressed
⑩米債保有高(兆ドル)
海外の米国債保有者の米国債保有額(%) ・・・増加
U.S. Treasury bond holdings (trillion dollars)
U.S. debt holdings by foreign holders of U.S. Treasuries (%) ・・・ Increasing
以下はグラフによるデータ推移(Source: Sputnik)
本文終了
|